Selection.join and Transitions
The Inspiration
The focus of this exercise is to practice a couple of the dynamic features of d3: transitions and the enter/update/exit lifecycle of selection.join.
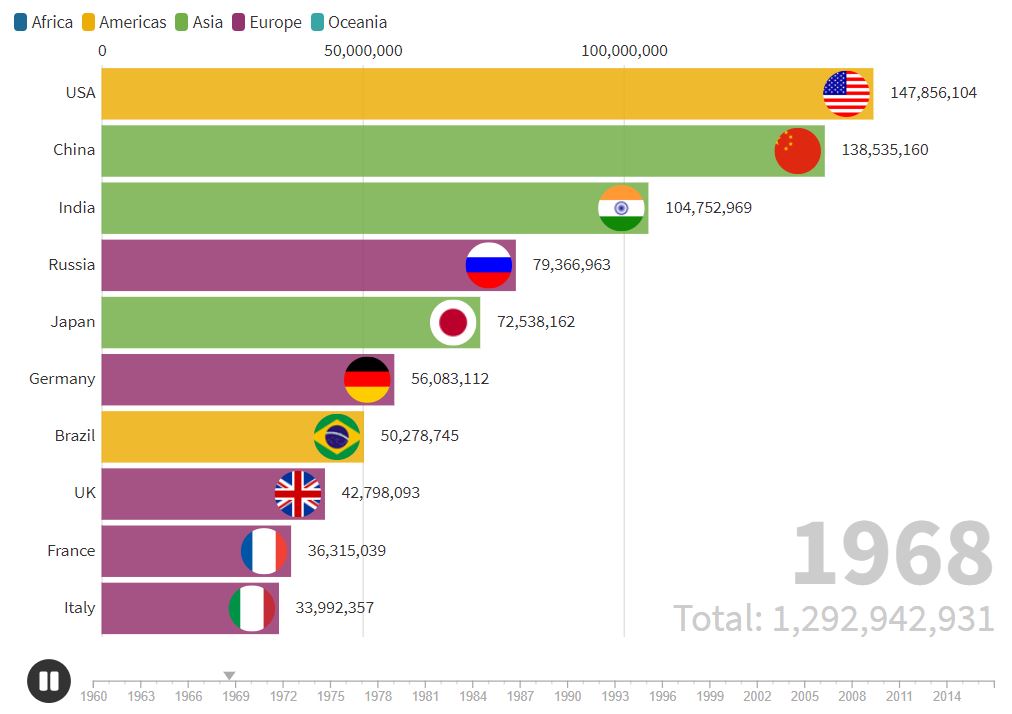
The initial inspiration came from the omnipresent Bar Chart Race visualizations, where a bar chart is animated to show rankings and volumes across time.
The Exercise
In the tradition of keeping it simple for these exercises, though, I got rid of the “bar chart” part of the bar chart race, and focused on the rankings part. I’ve always been fascinated by baby name popularity, so I generated a simple dataset from SSA Baby Names Data.
The idea is that the display dynamically shows the ranking of different names over a few years, with some names entering and some disappearing during that time. Here’s what I ended up with:
A Solution
My solution is below, but I encourage you to attempt it first without peeking. It’s important to read and grasp the docs onselection.join for this exercise. Transitions are optional but make things look much more polished.
Complete code and working example can be found on codepen. The baby name data I used is here.
d3.csv( "https://gist.githubusercontent.com/fraziern/6ca21ed36b217894901256aeab822f00/raw/b96d480d27d43f1bb11c3a0fe86f641070e6ce29/popular_names_ssa.csv")
.then(createChart);

function createChart(data) {
  // set margins by convention
  const margin = {top: 10, right: 20, bottom: 30, left: 20},
      width = 500 - margin.left - margin.right,
      height = 500 - margin.top - margin.bottom,
      textHeight = 24;

  var svg = d3.select(".chart")
    .append("svg")
      .attr("width", width + margin.left + margin.right)
      .attr("height", height + margin.top + margin.bottom);

  var chart = svg
    .append("g")
      .attr('transform', `translate(${margin.left}, ${margin.top})`);

  // scale
  let yAxis = d3.axisLeft(
    d3.scaleLinear()
    .domain([1,10])
    .range([0, textHeight * 9]));

  svg.append("g")
    .attr('transform', `translate(${margin.left}, ${margin.top + 20})`)
    .call(yAxis);

  // munge data
  let d = [];
  data.forEach(el => {
    let arr = d3.keys(el)
      .filter(k => k !== "Year")
      .map(k => ({name: k, rank: +el[k]}));
    d.push({Year: el.Year, Data: arr});
  });

  // colors
  const colors = d3.scaleOrdinal(d3.schemeCategory10)
    .domain(d3.keys(data));

  counter = 0;
  var i = setInterval(function() {
    const t = chart.transition()
        .duration(750);

    const top10 = d[counter].Data.filter(el => el.rank <= 10);

    chart.selectAll("text")
      .data(top10, d => d.name)
      .join(
        enter => enter.append("text")
            .attr("y", d => d.rank * textHeight)
            .attr("x", 0)
            .text(d => d.name)
            .attr("fill", "white")
          .call(enter => enter.transition(t)
            .attr("fill", d => colors(d.name))),
        update => update
            .attr("x", 0)
          .call(update => update.transition(t)
            .attr("y", d => d.rank * textHeight)),
        );

    document.querySelector(".year").innerText = d[counter].Year;

    counter++;
    if (counter >= d.length) clearInterval(i);

  }, 1000);
}