Bite-sized data visualization exercises using D3.js, with inspiration from the best of the web and beyond.
“For the things we have to learn before we can do them, we learn by doing them.” ― Aristotle, The Nicomachean Ethics
-
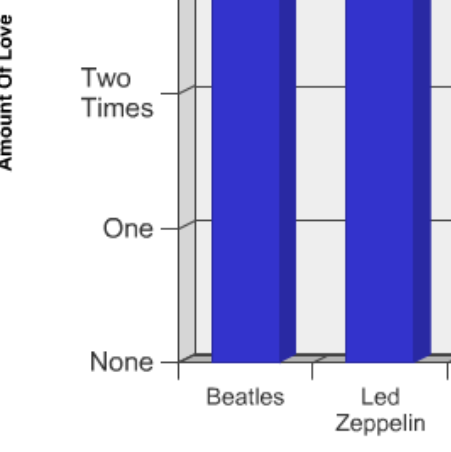
01
Bar Graph with Text Ticks
-

02
Vertically Centered Time Series
-
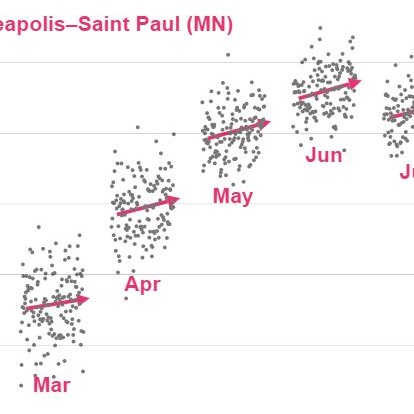
03
Compound Scatter/Bar Graph
-
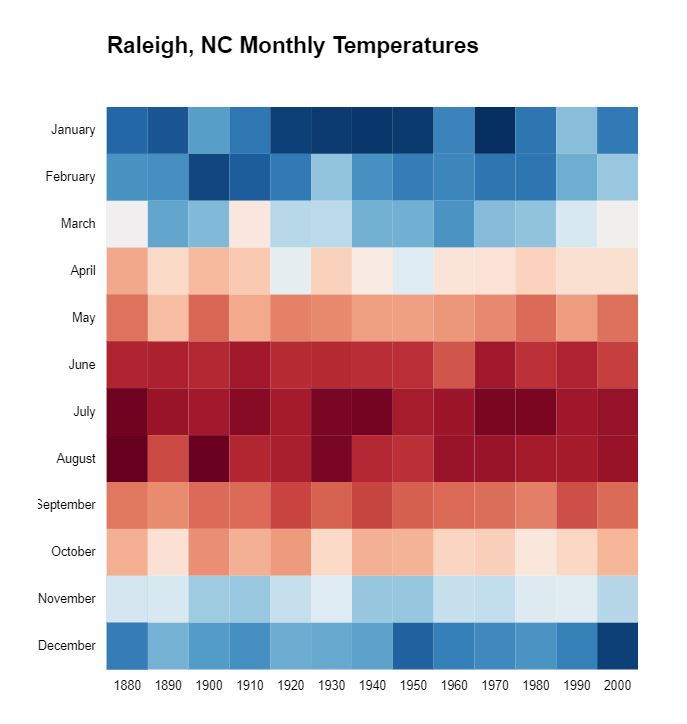
04
Heatmap
-
05
Selection.join and Transitions
-
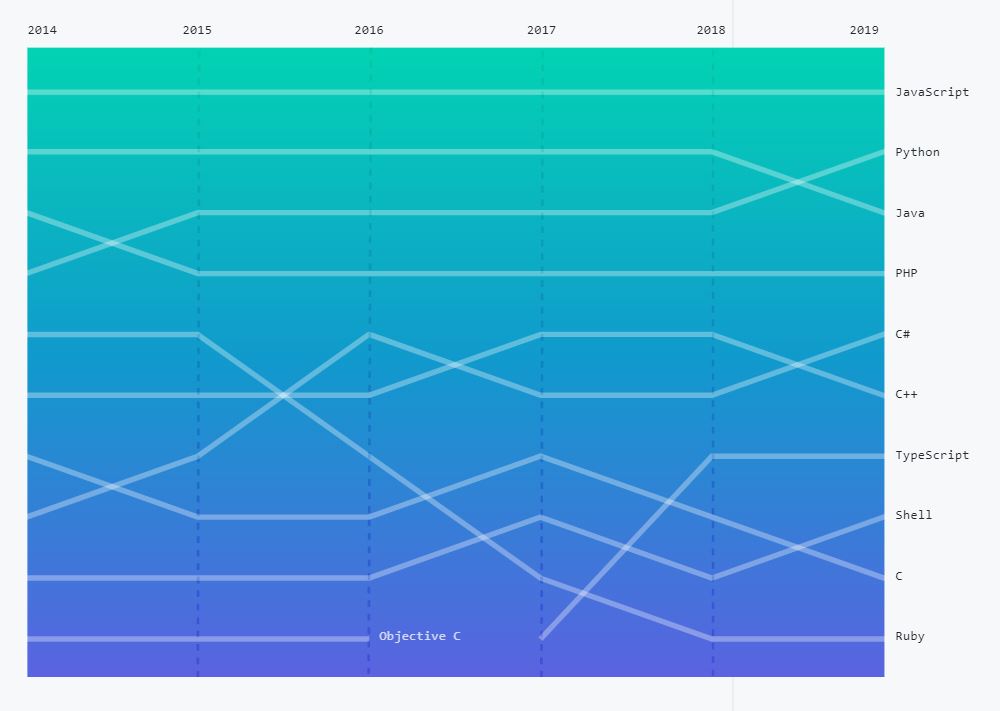
06
Slopegraph (pt. 1)
-
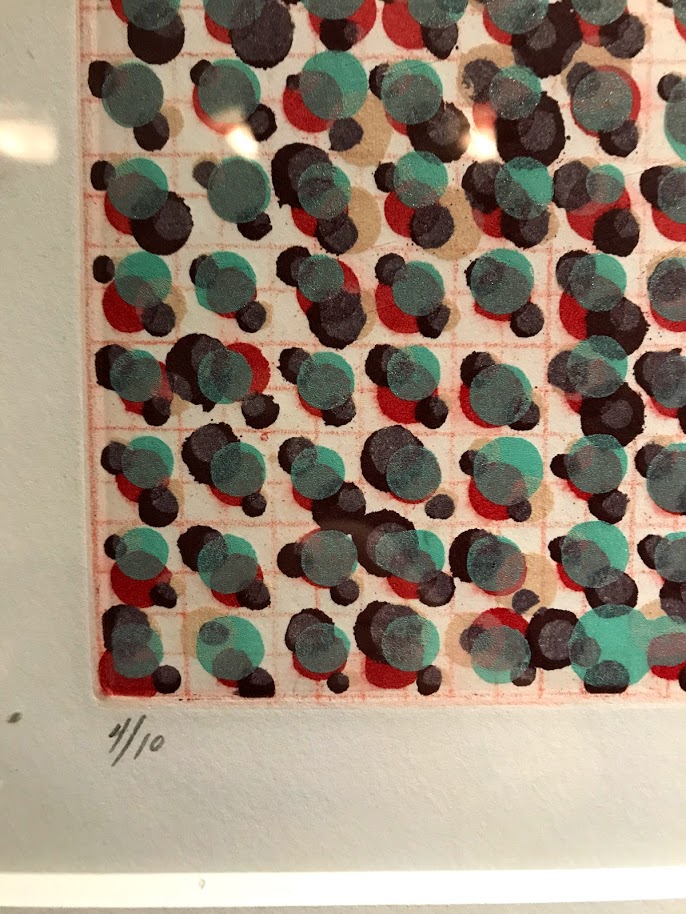
07
Generative Art on a Grid
-
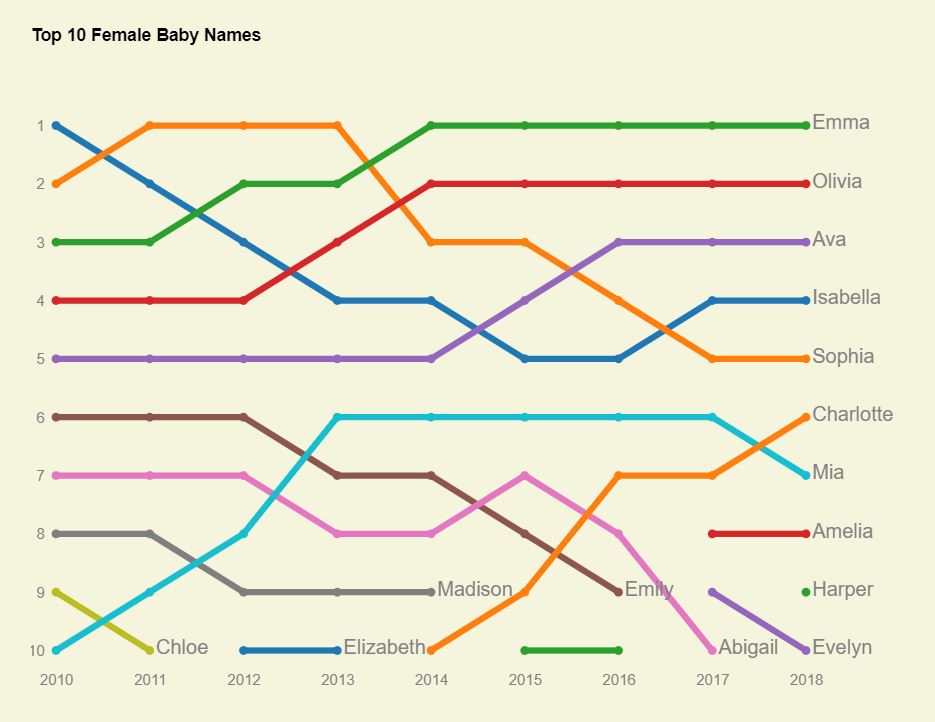
08
Slopegraph pt.2: Improved with Data Points
-
09
Stacked Bar Chart
-
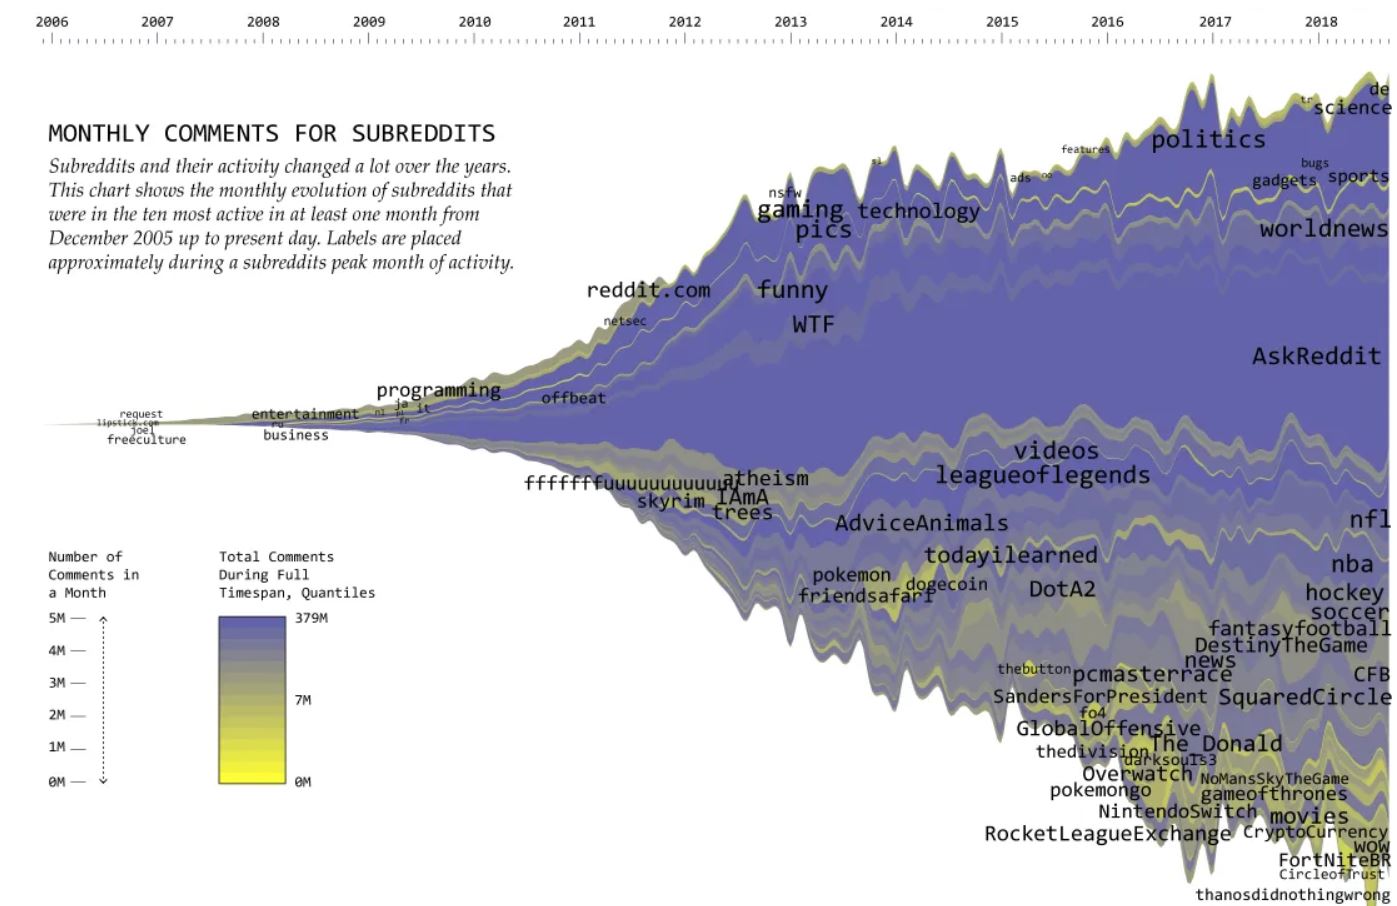
10
A Streamgraph
-

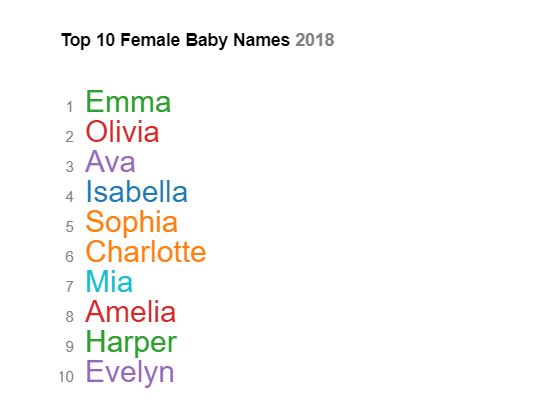
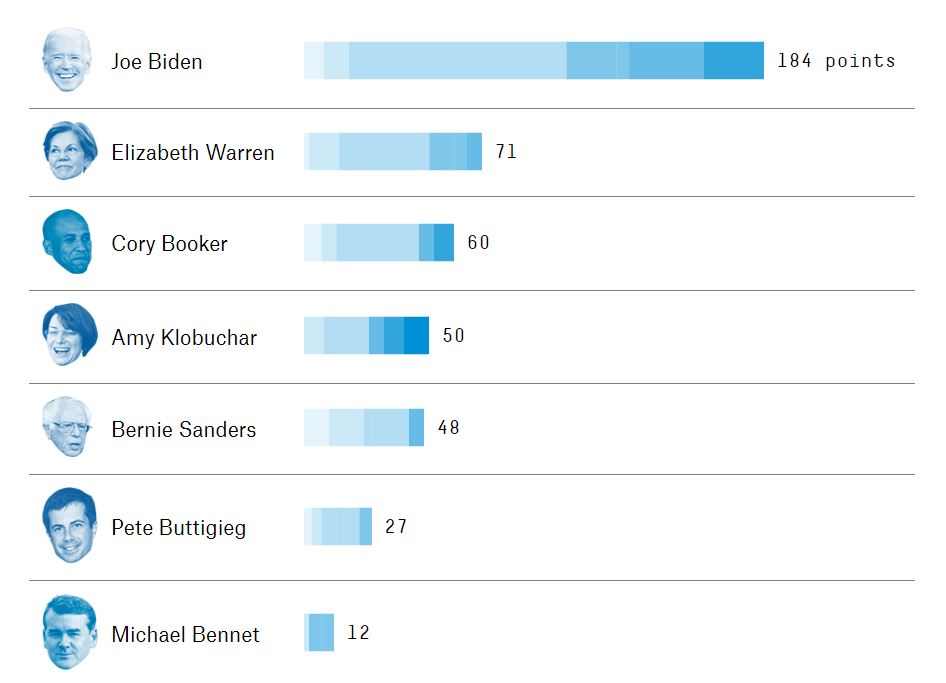
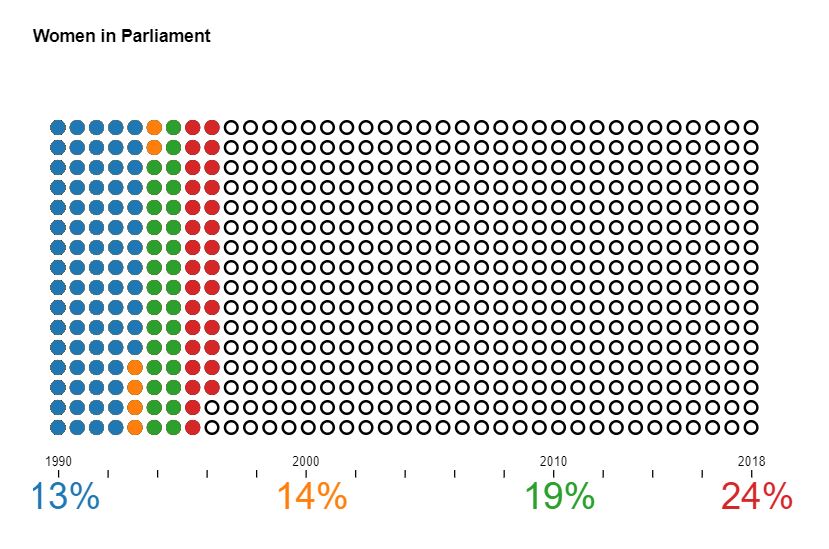
11
Pictogram (Part 1)
-
12
Pictogram (Part 2)
-
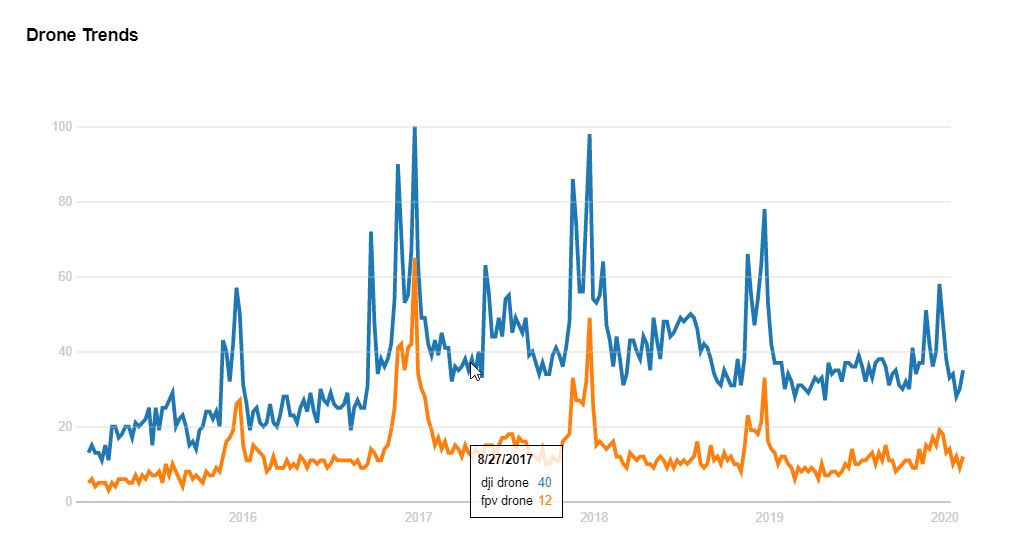
13
Adding a Tooltip To A Chart
-
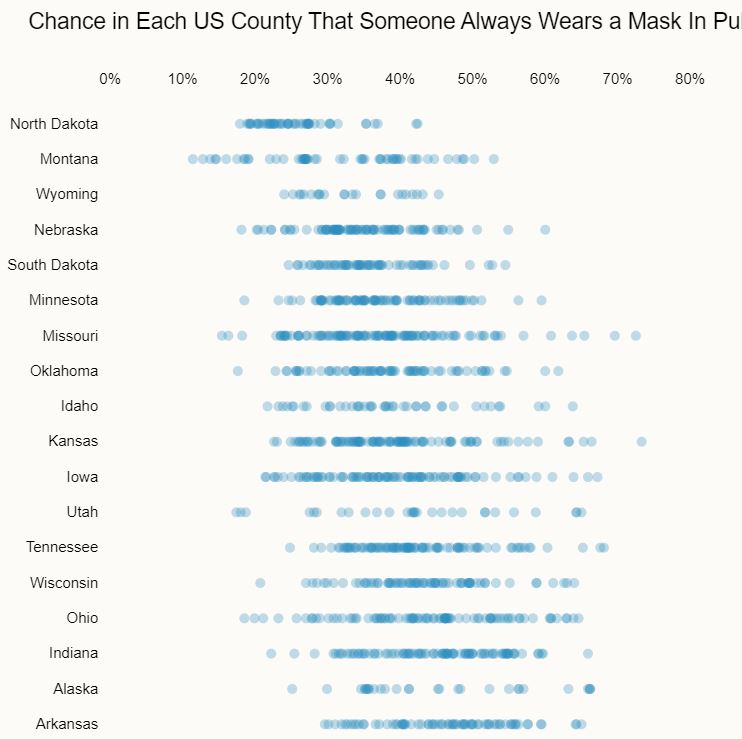
14
Displaying Distributions