Vertically Centered Time Series
Welcome to d3aday! If this is your first time, we recommend reading the about page before jumping in.
The Inspiration
This exercise is inspired by this excellent visualization of Ironman championship medals by Shivaraj on Tableau Public.
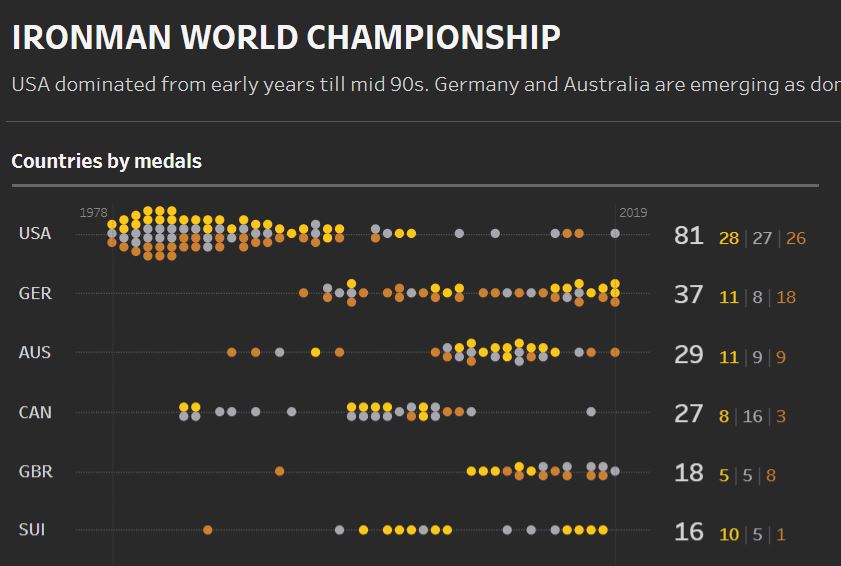
I particularly like the innovative use of data points (that look like medals!), stacked and centered along a timeline.
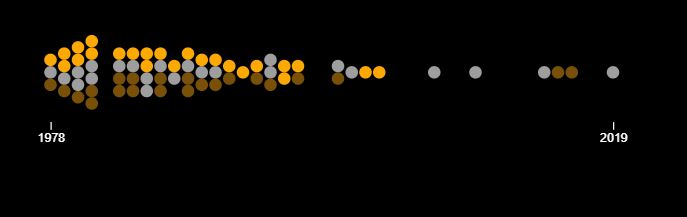
The Exercise
For the exercise, we’ll simplify things way down, keeping it to one country, USA, and removing most of the extras. Shivaraj’s key feature is kept, though - horizontally centered, stacked “medals” by year.
The complete data is below (JSON format).
[{"Athlete":"Gordon Haller","Country":"USA","Place":"Gold","Year":1978},{"Athlete":"John Dunbar","Country":"USA","Place":"Silver","Year":1978},{"Athlete":"Dave Orlowski","Country":"USA","Place":"Bronze","Year":1978},{"Athlete":"Lyn Lemaire","Country":"USA","Place":"Gold","Year":1979},{"Athlete":"Tom Warren","Country":"USA","Place":"Gold","Year":1979},{"Athlete":"John Dunbar","Country":"USA","Place":"Silver","Year":1979},{"Athlete":"Ian Emberson","Country":"USA","Place":"Bronze","Year":1979},{"Athlete":"Robin Beck","Country":"USA","Place":"Gold","Year":1980},{"Athlete":"Dave Scott","Country":"USA","Place":"Gold","Year":1980},{"Athlete":"Eve Anderson","Country":"USA","Place":"Silver","Year":1980},{"Athlete":"Chuck Neumann","Country":"USA","Place":"Silver","Year":1980},{"Athlete":"John Howard","Country":"USA","Place":"Bronze","Year":1980},{"Athlete":"Linda Sweeney","Country":"USA","Place":"Gold","Year":1981},{"Athlete":"John Howard","Country":"USA","Place":"Gold","Year":1981},{"Athlete":"Sally Edwards","Country":"USA","Place":"Silver","Year":1981},{"Athlete":"Tom Warren","Country":"USA","Place":"Silver","Year":1981},{"Athlete":"Lyn Brooks","Country":"USA","Place":"Bronze","Year":1981},{"Athlete":"Scott Tinley","Country":"USA","Place":"Bronze","Year":1981},{"Athlete":"Dave Scott","Country":"USA","Place":"Gold","Year":1983},{"Athlete":"Scott Tinley","Country":"USA","Place":"Silver","Year":1983},{"Athlete":"Eva Ueltzen","Country":"USA","Place":"Bronze","Year":1983},{"Athlete":"Mark Allen","Country":"USA","Place":"Bronze","Year":1983},{"Athlete":"Dave Scott","Country":"USA","Place":"Gold","Year":1984},{"Athlete":"Scott Tinley","Country":"USA","Place":"Silver","Year":1984},{"Athlete":"Julie Olson","Country":"USA","Place":"Bronze","Year":1984},{"Athlete":"Grant Boswell","Country":"USA","Place":"Bronze","Year":1984},{"Athlete":"Joanne Ernst","Country":"USA","Place":"Gold","Year":1985},{"Athlete":"Scott Tinley","Country":"USA","Place":"Gold","Year":1985},{"Athlete":"Elizabeth Bulman","Country":"USA","Place":"Silver","Year":1985},{"Athlete":"Chris Hinshaw","Country":"USA","Place":"Silver","Year":1985},{"Athlete":"Dave Scott","Country":"USA","Place":"Gold","Year":1986},{"Athlete":"Mark Allen","Country":"USA","Place":"Silver","Year":1986},{"Athlete":"Joanne Ernst","Country":"USA","Place":"Bronze","Year":1986},{"Athlete":"Scott Tinley","Country":"USA","Place":"Bronze","Year":1986},{"Athlete":"Dave Scott","Country":"USA","Place":"Gold","Year":1987},{"Athlete":"Mark Allen","Country":"USA","Place":"Silver","Year":1987},{"Athlete":"Scott Molina","Country":"USA","Place":"Gold","Year":1988},{"Athlete":"Mike Pigg","Country":"USA","Place":"Silver","Year":1988},{"Athlete":"Kirsten Hanssen","Country":"USA","Place":"Bronze","Year":1988},{"Athlete":"Ken Glah","Country":"USA","Place":"Bronze","Year":1988},{"Athlete":"Mark Allen","Country":"USA","Place":"Gold","Year":1989},{"Athlete":"Dave Scott","Country":"USA","Place":"Silver","Year":1989},{"Athlete":"Kirsten Hanssen","Country":"USA","Place":"Bronze","Year":1989},{"Athlete":"Mark Allen","Country":"USA","Place":"Gold","Year":1990},{"Athlete":"Scott Tinley","Country":"USA","Place":"Silver","Year":1990},{"Athlete":"Terri Schneider","Country":"USA","Place":"Bronze","Year":1990},{"Athlete":"Mark Allen","Country":"USA","Place":"Gold","Year":1991},{"Athlete":"Jeff Devlin","Country":"USA","Place":"Bronze","Year":1991},{"Athlete":"Mark Allen","Country":"USA","Place":"Gold","Year":1992},{"Athlete":"Mark Allen","Country":"USA","Place":"Gold","Year":1993},{"Athlete":"Susan Latshaw","Country":"USA","Place":"Bronze","Year":1993},{"Athlete":"Karen Smyers","Country":"USA","Place":"Silver","Year":1994},{"Athlete":"Dave Scott","Country":"USA","Place":"Silver","Year":1994},{"Athlete":"Jeff Devlin","Country":"USA","Place":"Bronze","Year":1994},{"Athlete":"Karen Smyers","Country":"USA","Place":"Gold","Year":1995},{"Athlete":"Mark Allen","Country":"USA","Place":"Gold","Year":1995},{"Athlete":"Paula Newby-Fraser\\u2020","Country":"USA","Place":"Gold","Year":1996},{"Athlete":"Karen Smyers","Country":"USA","Place":"Bronze","Year":1996},{"Athlete":"Karen Smyers","Country":"USA","Place":"Silver","Year":1999},{"Athlete":"Tim DeBoom","Country":"USA","Place":"Bronze","Year":1999},{"Athlete":"Tim DeBoom","Country":"USA","Place":"Silver","Year":2000},{"Athlete":"Tim DeBoom","Country":"USA","Place":"Gold","Year":2001},{"Athlete":"Tim DeBoom","Country":"USA","Place":"Gold","Year":2002},{"Athlete":"Desiree Ficker","Country":"USA","Place":"Silver","Year":2006},{"Athlete":"Chris Lieto","Country":"USA","Place":"Silver","Year":2009},{"Athlete":"Ben Hoffman","Country":"USA","Place":"Silver","Year":2014},{"Athlete":"Timothy O'Donnell","Country":"USA","Place":"Bronze","Year":2015},{"Athlete":"Heather Jackson","Country":"USA","Place":"Bronze","Year":2016},{"Athlete":"Tim O'Donnell","Country":"USA","Place":"Silver","Year":2019}]A Solution
My solution is below, but I encourage you to attempt it first without peeking. Complete code and working example can be found on codepen.
let dataNested = d3.nest()
  .key(function(d) { return d.Country; })
  .key(function(d) { return d.Year; })
  .entries(jsonData);

// for now just pull out the USA values
let data = dataNested.filter(e => e.key = "USA")[0].values;

let dateRange = {min: 1978, max: 2019};

// set margins by convention
var margin = {top: 50, right: 20, bottom: 30, left: 30},
    width = 500 - margin.left - margin.right,
    height = 150 - margin.top - margin.bottom;

var chart = d3.select(".chart")
  .append("svg")
    .attr("width", width + margin.left + margin.right)
    .attr("height", height + margin.top + margin.bottom)
  .append("g")
    .attr('transform', `translate(${margin.left}, ${margin.top})`);

// X scale
var x = d3.scaleLinear()
    .rangeRound([0, width])
    .domain([dateRange.min, dateRange.max]);

const circleRadius = 5;

function yOffset(data) {
  count = data.values.length;
  return -circleRadius * (count - 1);
}

const colors = {
  "Bronze": "#785007",
  "Silver": "#9e9e9d",
  "Gold": "#fca903"
}

// years groupings
var years = chart.selectAll("g")
    .data(data)
  .enter().append("g")
    .attr("transform", (d, i) => "translate(" + x(d.key) + "," + yOffset(d) + ")");

years.selectAll("circle")
  .data(d => d.values)
  .enter()
  .append("circle")
  .attr("cy", (d, i) => i * circleRadius * 2)
  .attr("r", circleRadius)
  .attr("fill", d => colors[d.Place]);

// add axis
let axis = d3.axisBottom(x)
  .ticks(2, "f")
  .tickValues([dateRange.min, dateRange.max]);

chart
  .append("g")
    .attr("transform", "translate(0,40)")
    .call(axis);